Kedi is a very amazing and straightforward tool that simplifies low-level debugging processes. Just click and see!
Kedi analyses issues in .NET applications. In most cases, applications hide debugging information during production. Memory Dump Analyzer helps you find and fix these issues which range from low CPU hangs, slow response rates, memory leaks and crashes. Kedi is a very straightforward and easy-to-use memory analyzer that allows users to open and analyze memory dump files.
Windbg is a powerful dump file inspection tool. With it, you can deep-dive into any application’s memory and troubleshoot every production-related issue. While Windbg is a great tool for dump file inspection, it works best with other tools that help make inspection fast and simple. Kedi is one of such tools, as with it, you can see a complete and perfect picture of the application’s state in the dump file.
*For now, Kedi only supports dump file analysis. We are working on adding Process Attach Methods soon.
Features
- Simple Object Inspection
- Synchronization Analysis
- Memory Statistics
- Free-Text Memory Search
- Call Stack Analysis
- View Threads Information
- Duplicate Strings Analysis
- Exceptions in the Memory
- Finalizer Queue and Pinned Objects
Fast tour
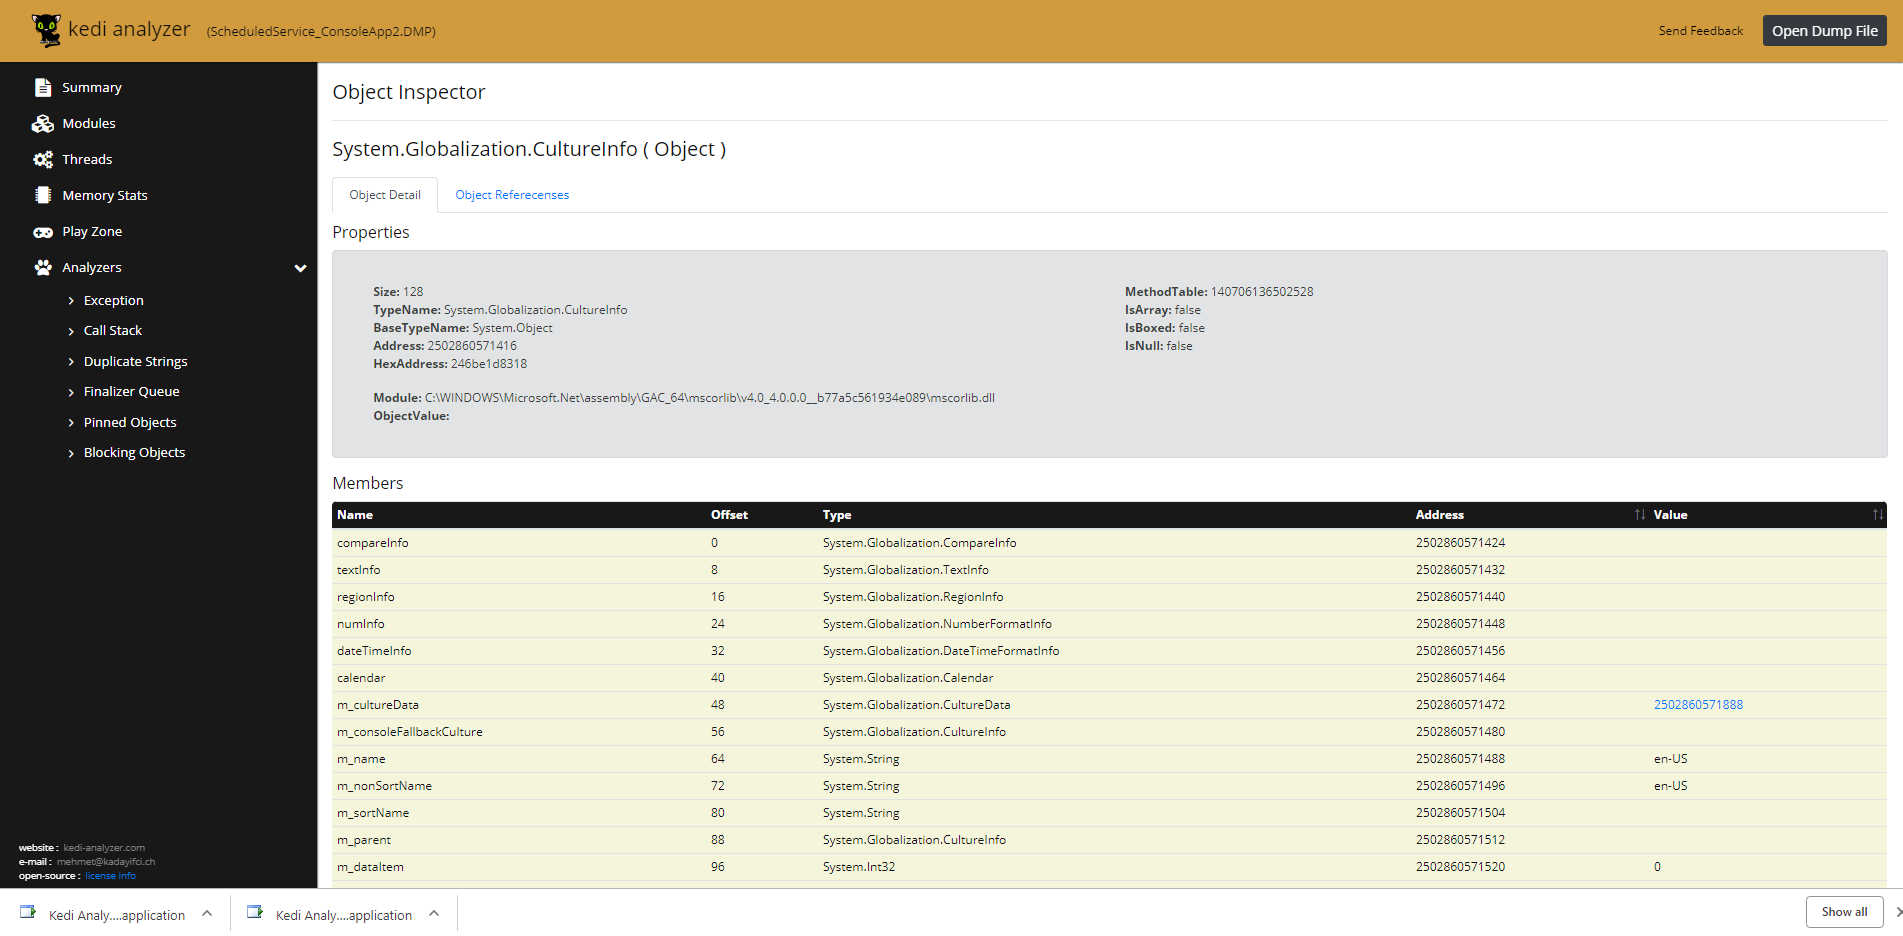
Simple Object Inspection
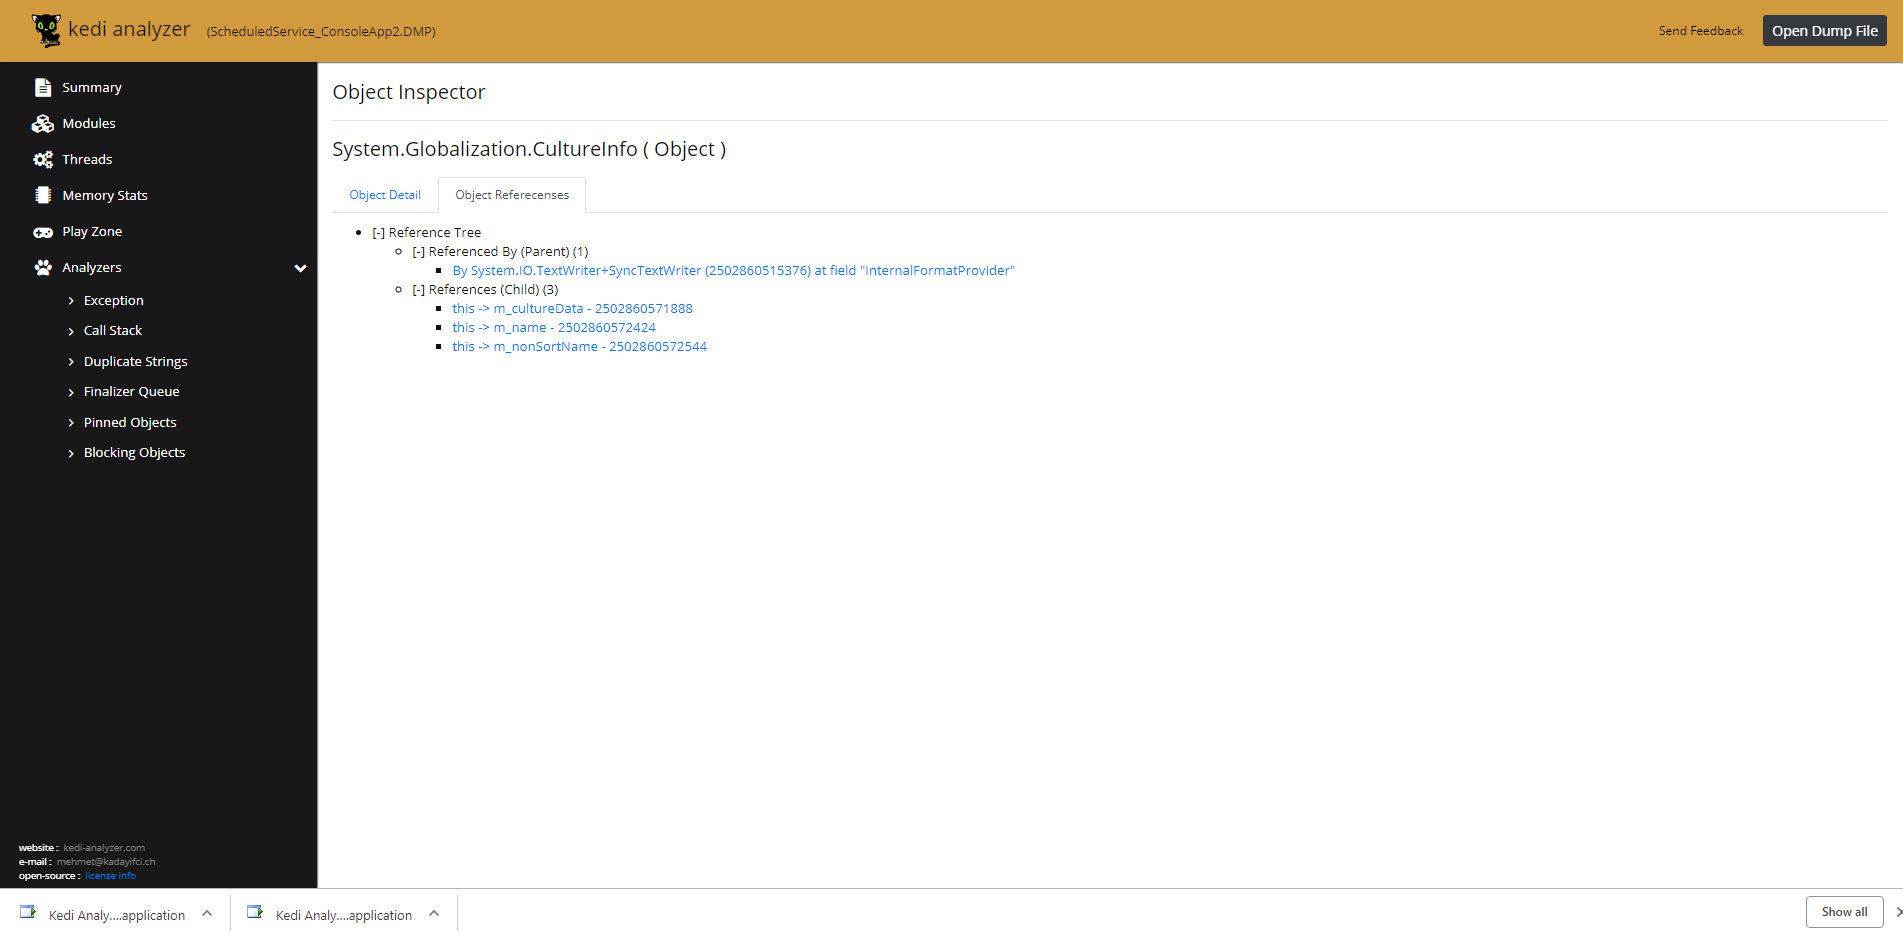
With Kedi, you can inspect various objects in any application’s memory by simply clicking on them. Kedi automatically represents well-known object types such as Date, Time, Arrays, etc. allowing you to browse members of any object. (See Image 1).
Kedi analyzes all object references to help you view all objects that point to a particular parent object as well as those objects that point to a particular child object. (See Image 2)


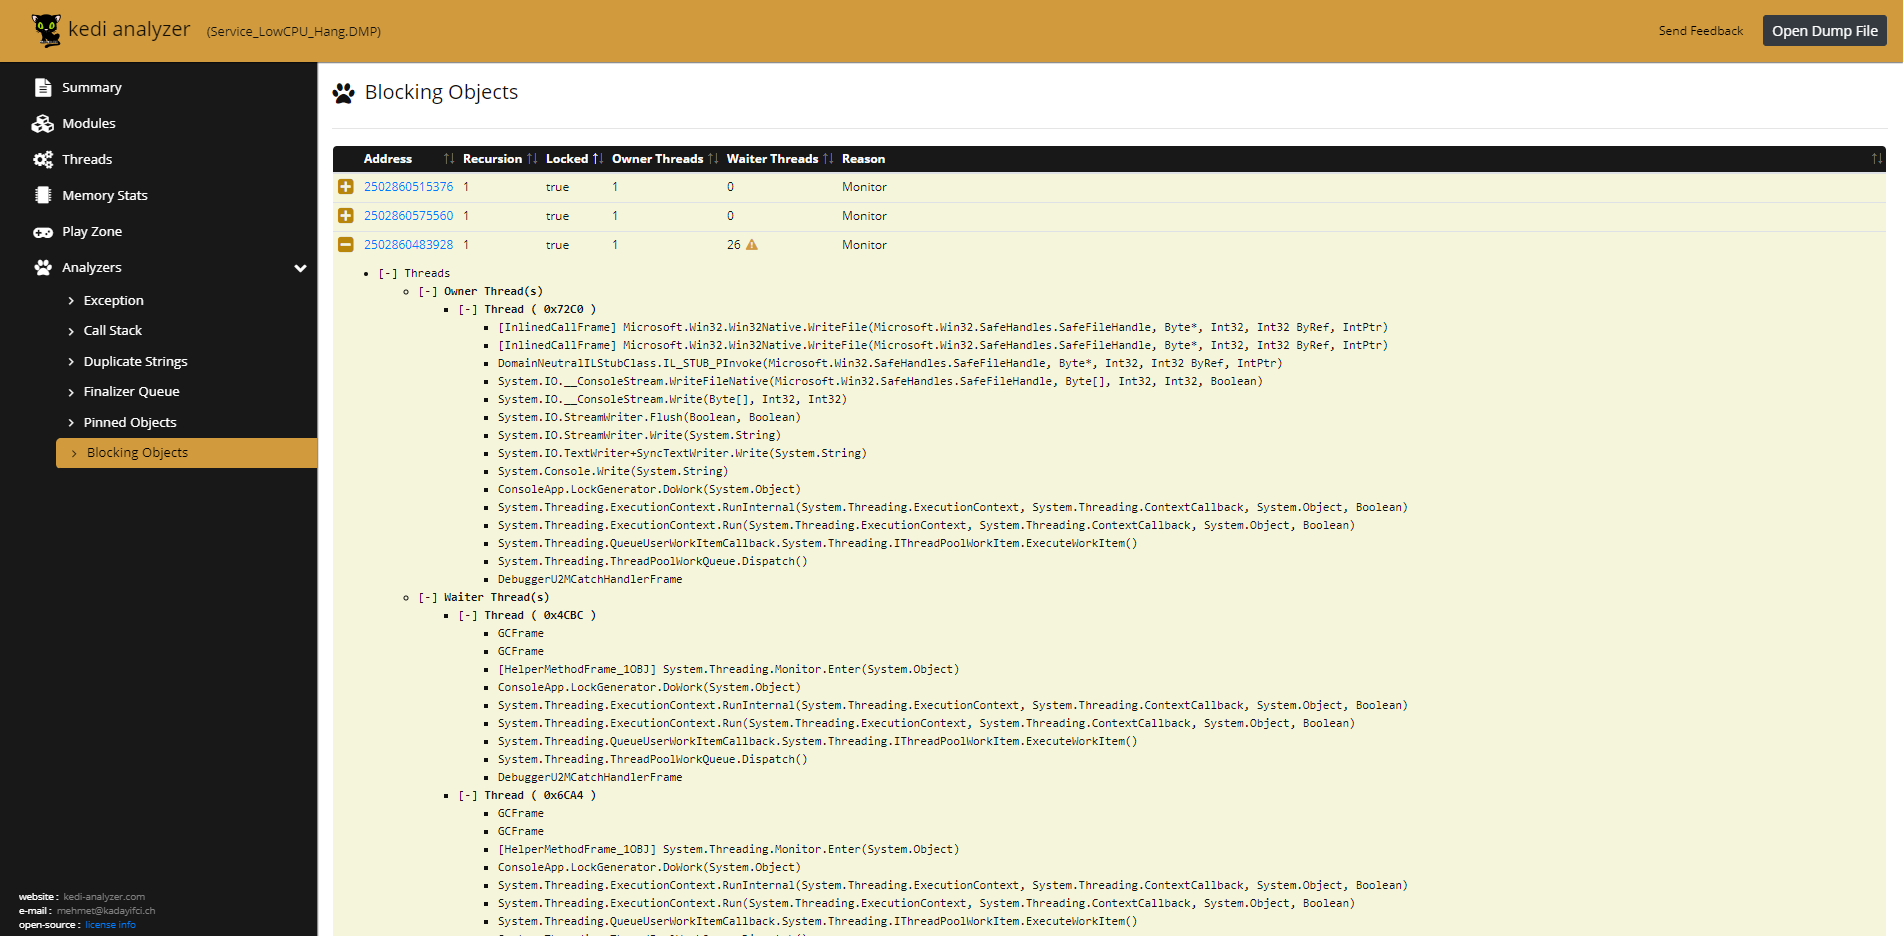
Synchronization Analyze – Low CPU Hangs
Kedi also helps users to automatically analyze blocking objects for the data source. With it, you can view synchronization objects in memory and inspect threads that relate to them.

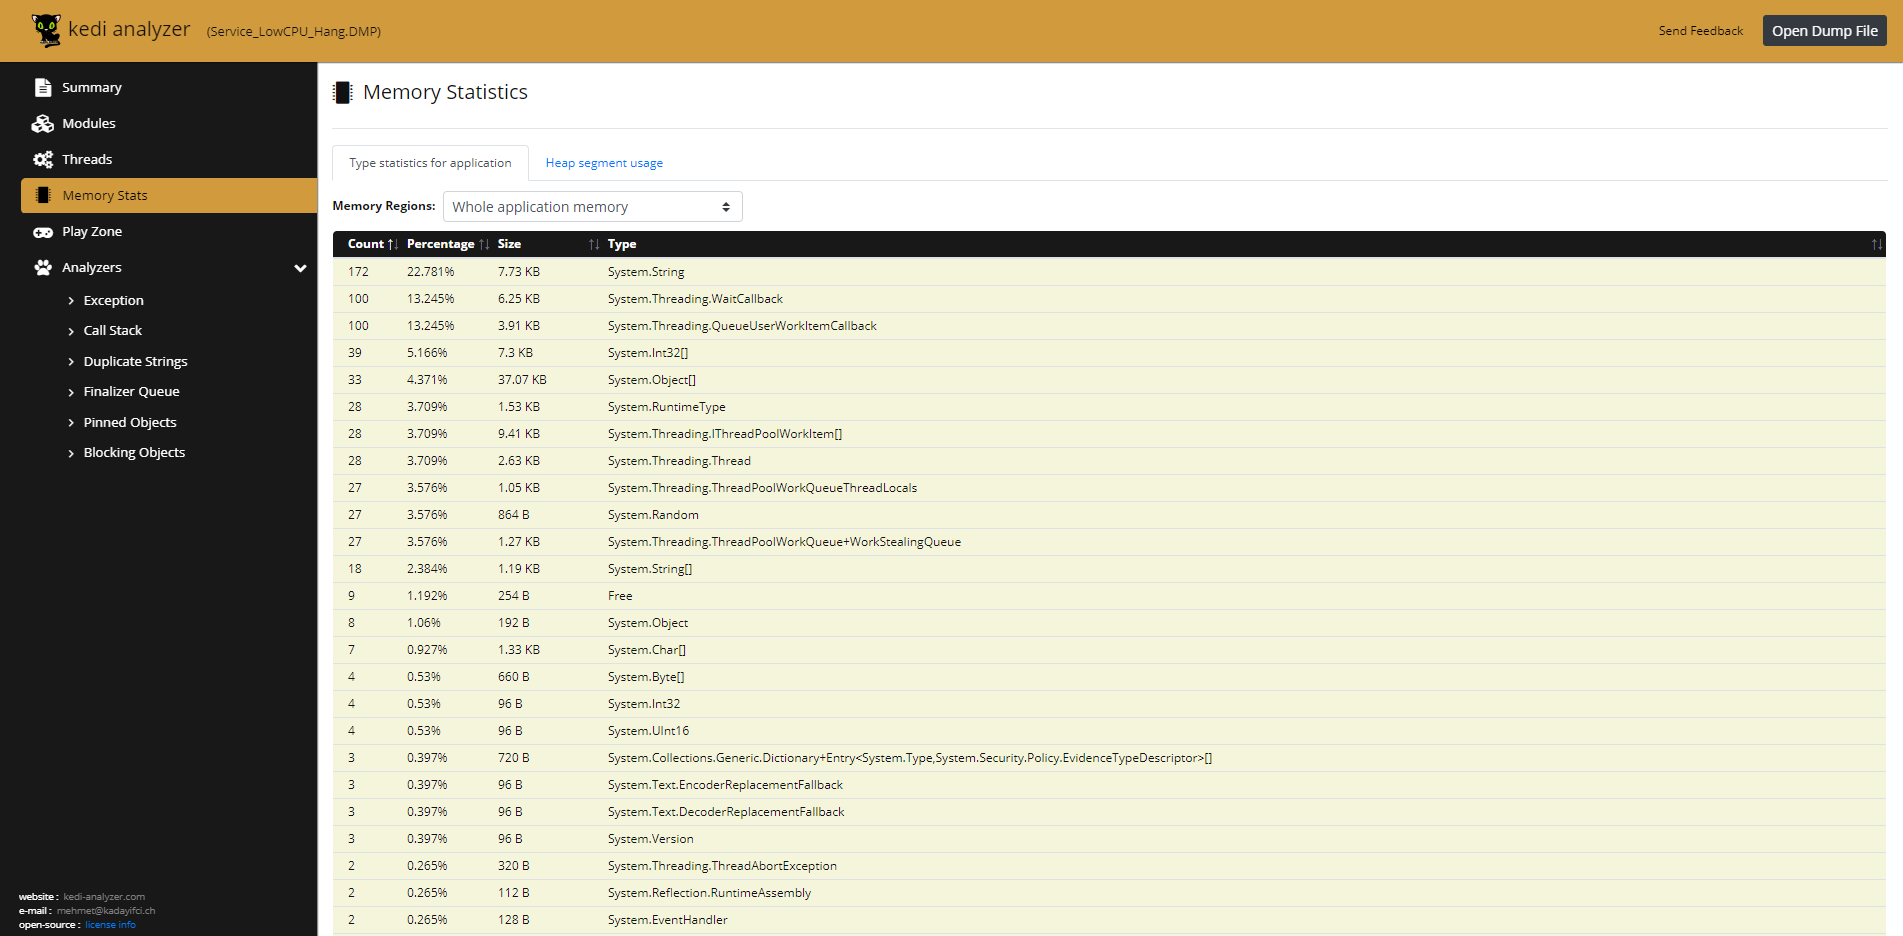
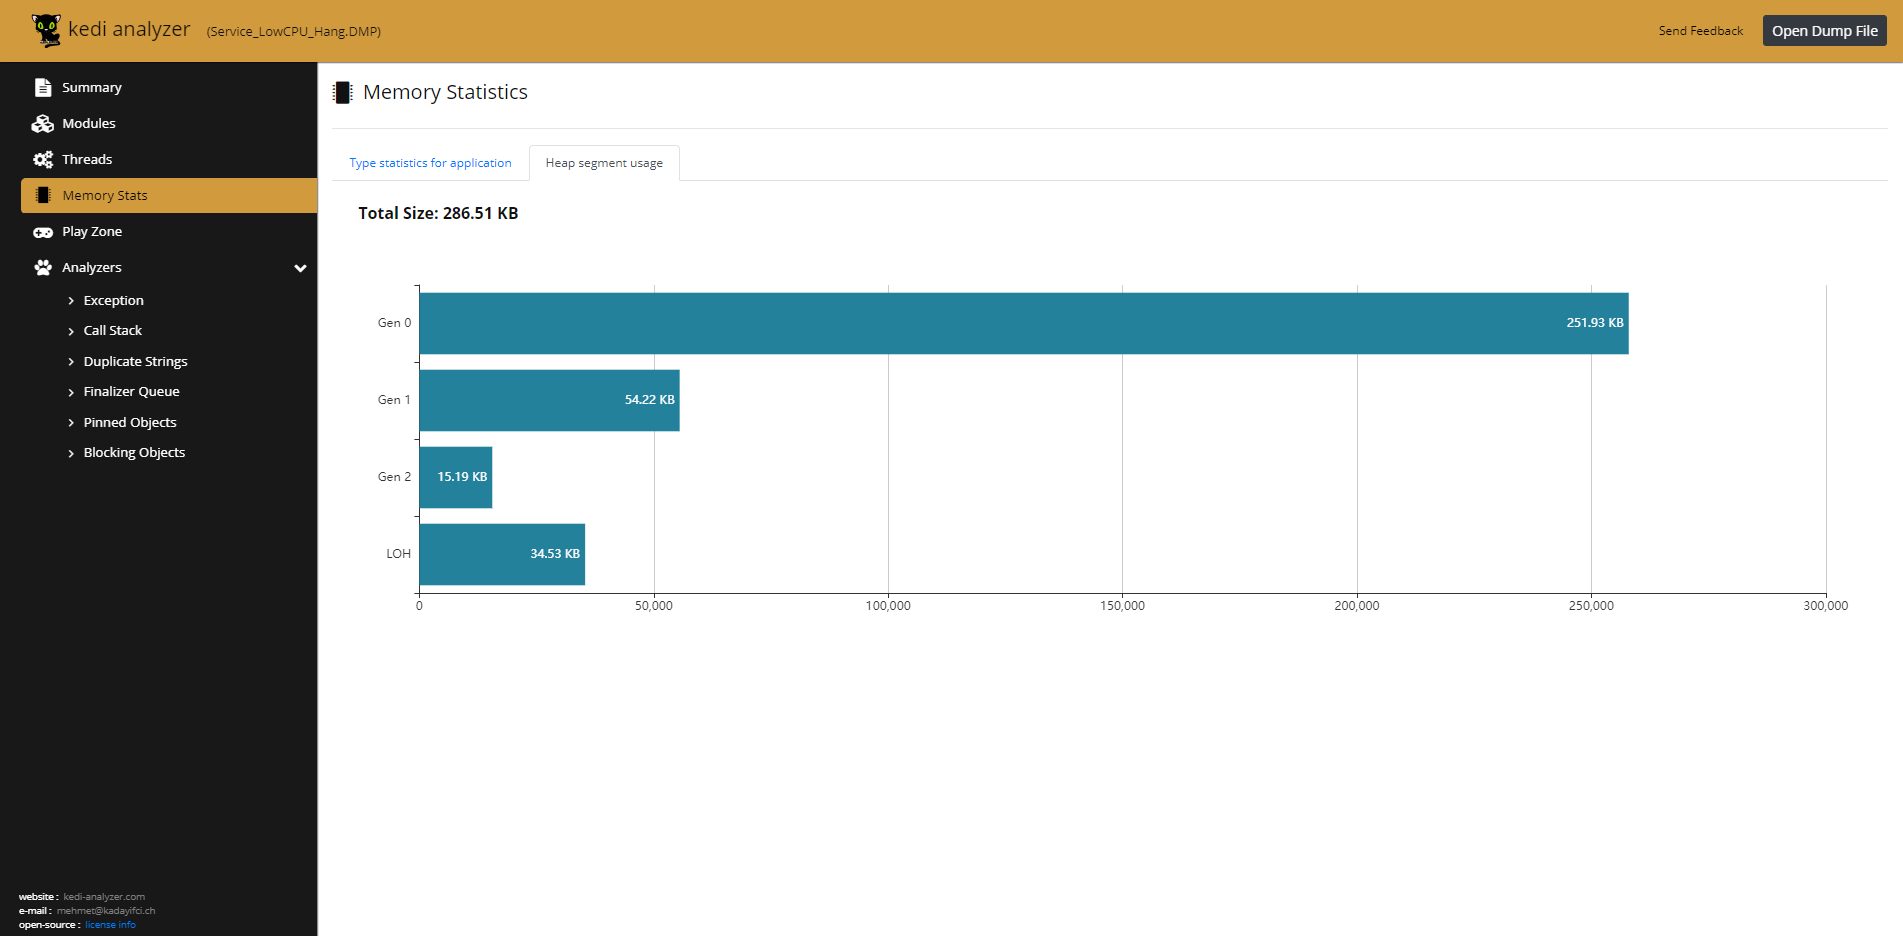
Memory Statistics
Kedi allows you to see different object types including counts and sizes. It also helps you filter results using memory generations like GEN0, GEN1, GEN2, LOH, and graphically-view usages.


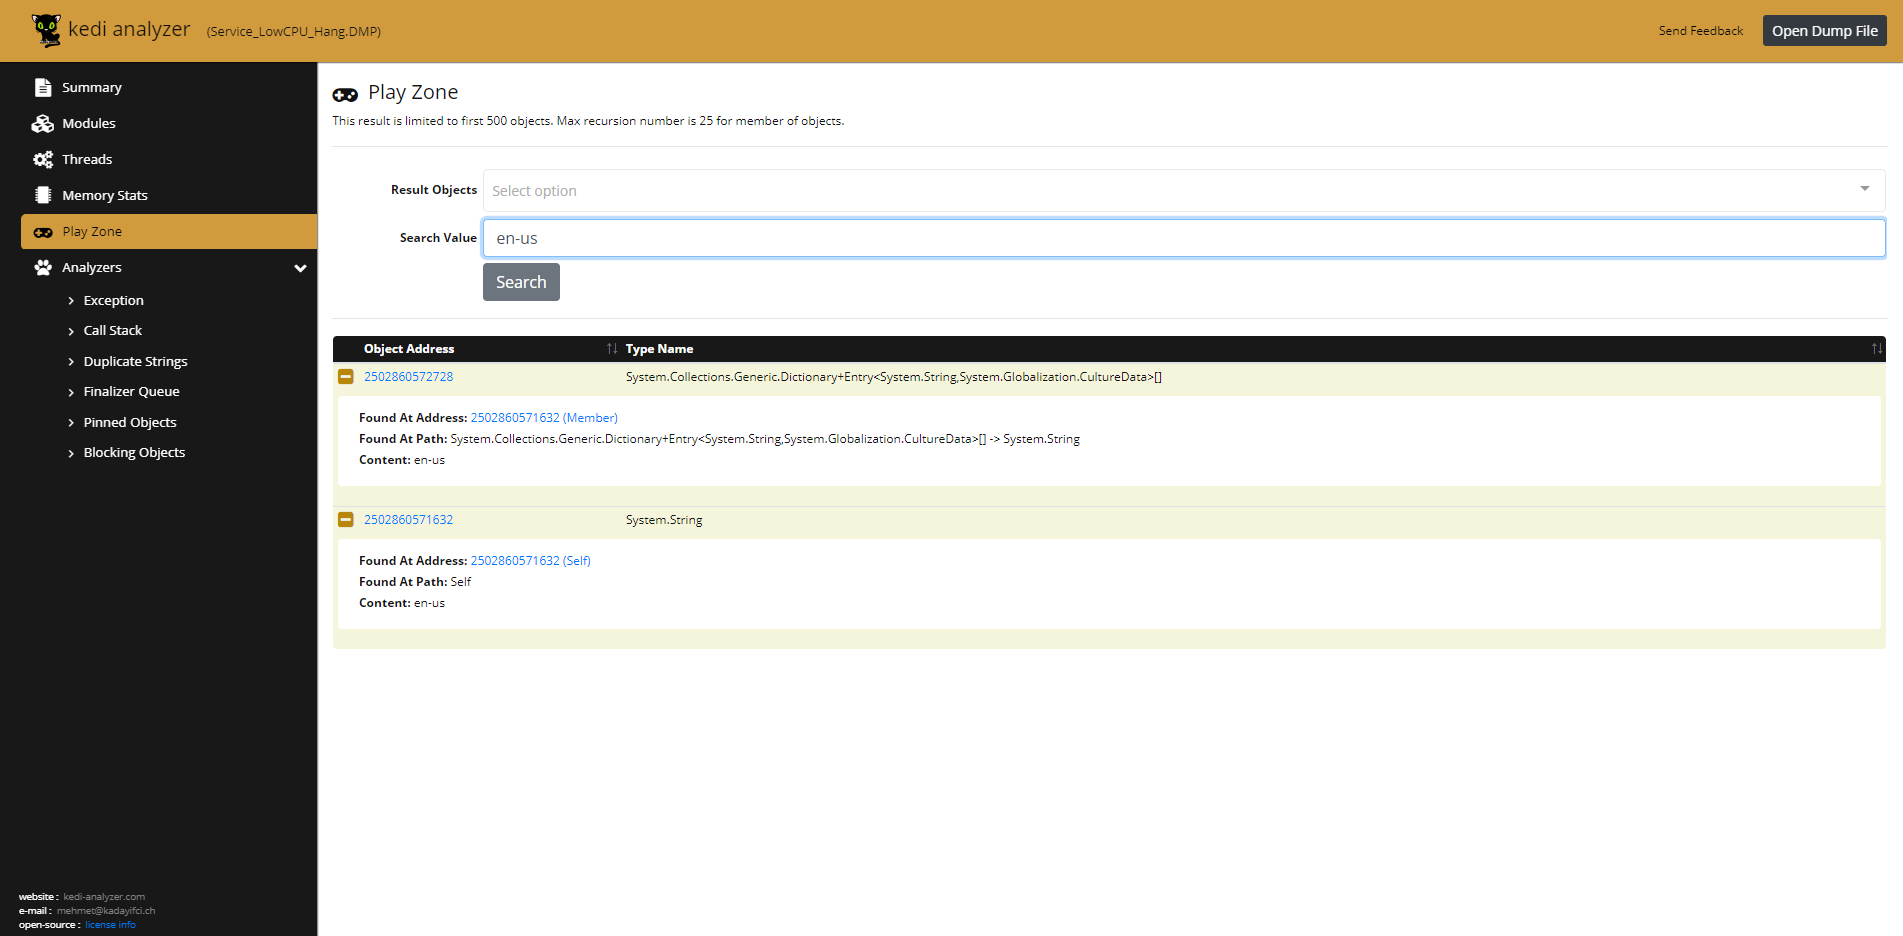
Free-Text Memory Search
Kedi allows you to search for a value in any application’s memory via Play Zone. For example, you can find a piece of connection information using a related connection string. You could also use it to find a magic number in a member.

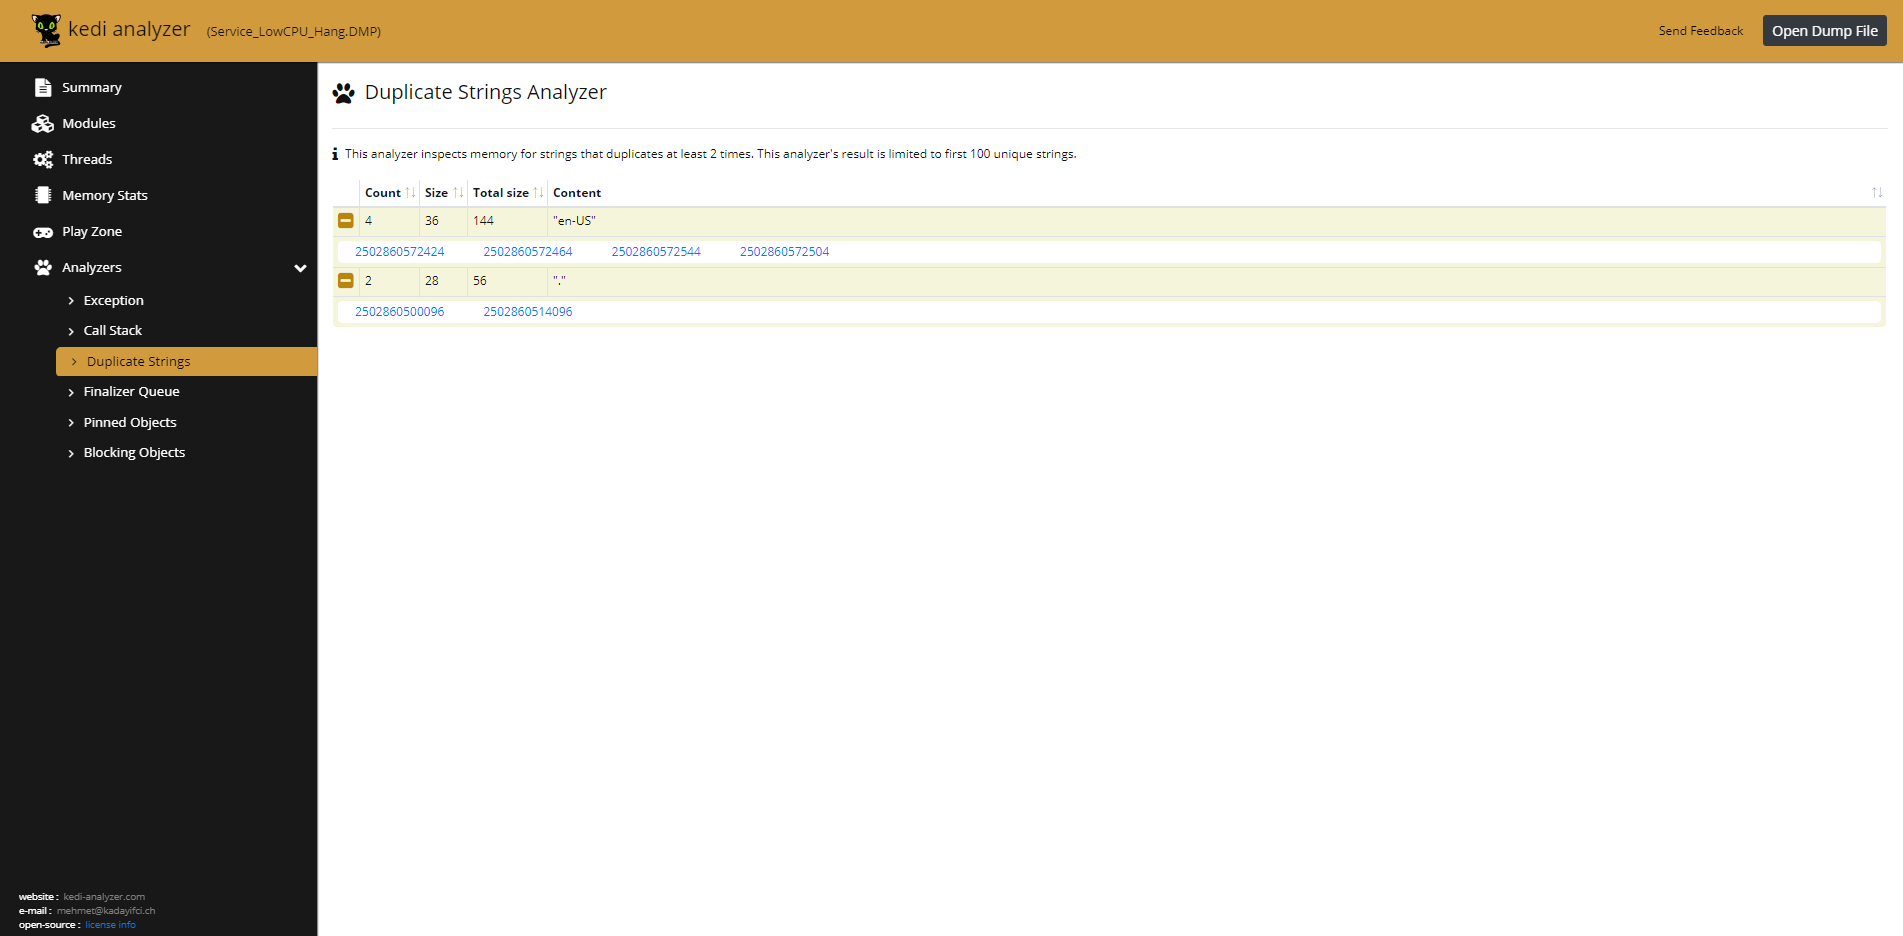
Duplicate Strings Analysis
Kedi can also help you analyze and optimize an application’s memory usage by reporting duplicated strings in memory. Duplicated strings can sometimes be a sign of a performance issue.

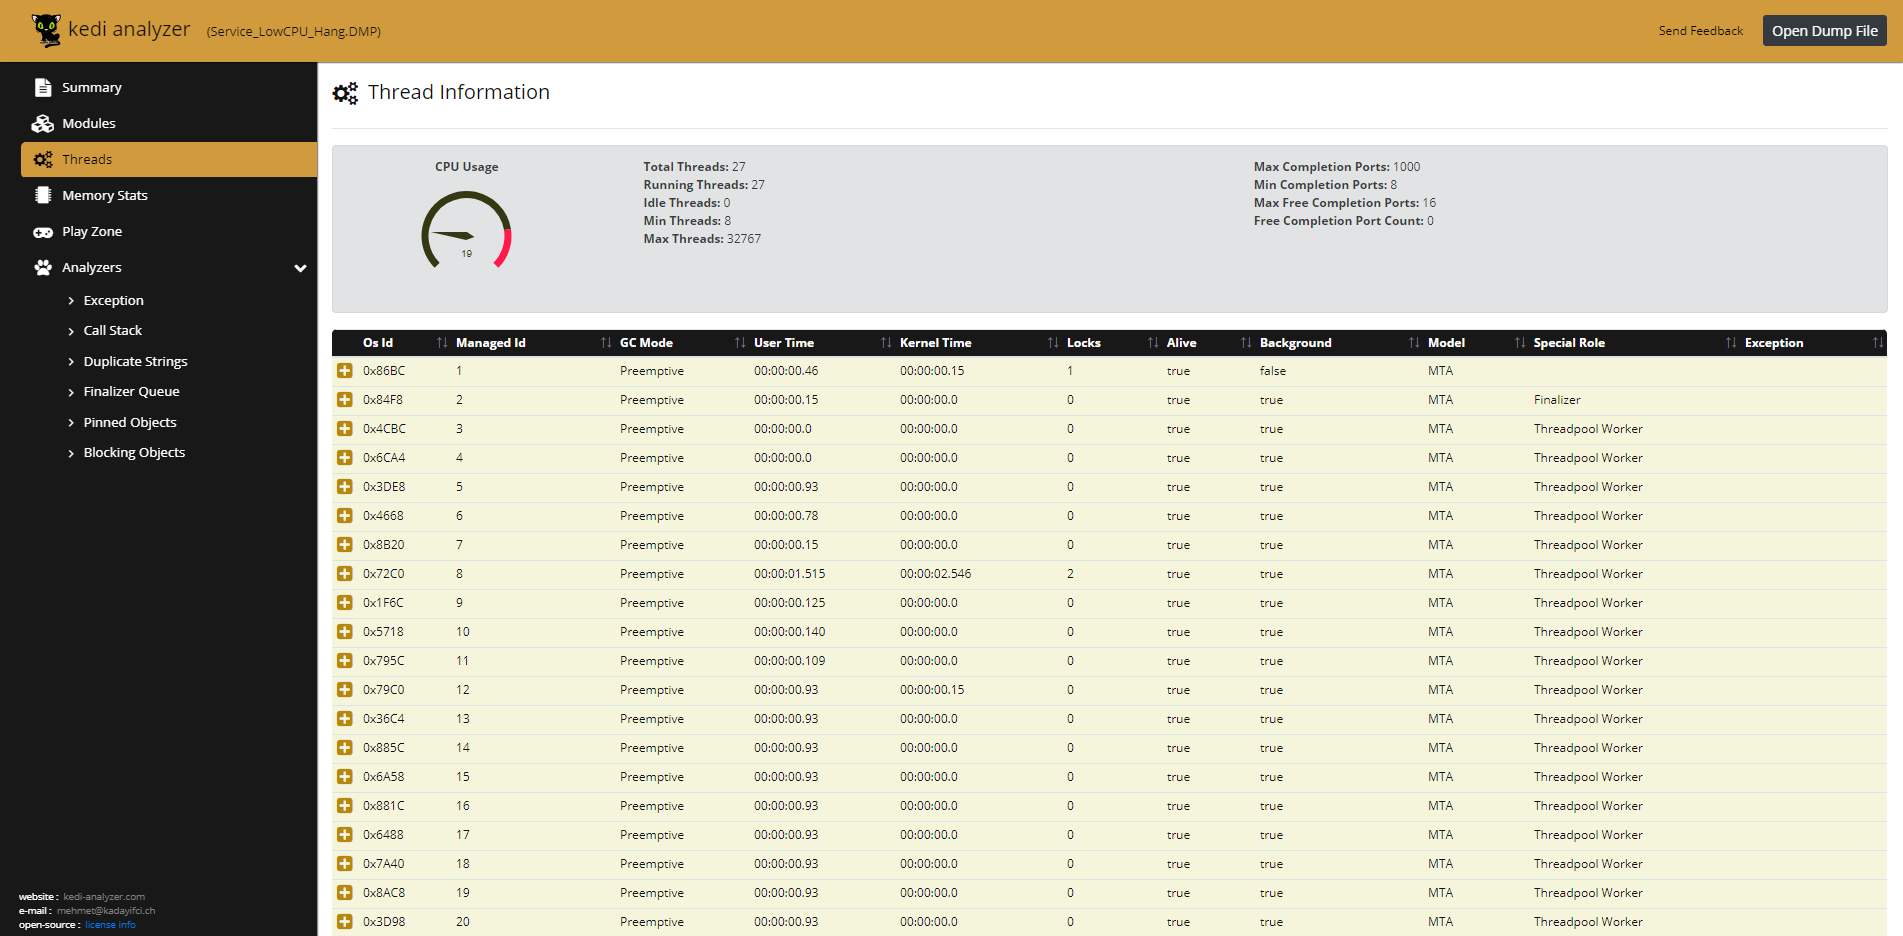
Thread Information
Threads are working parts of the application. Sometimes, threads may run too much causing your application to become unresponsive. Some, they tend to not run at all causing the same problem of unresponsiveness. Kedi allows you to find out a lot of vital information about application threads, helping you to diagnose responsiveness issues.


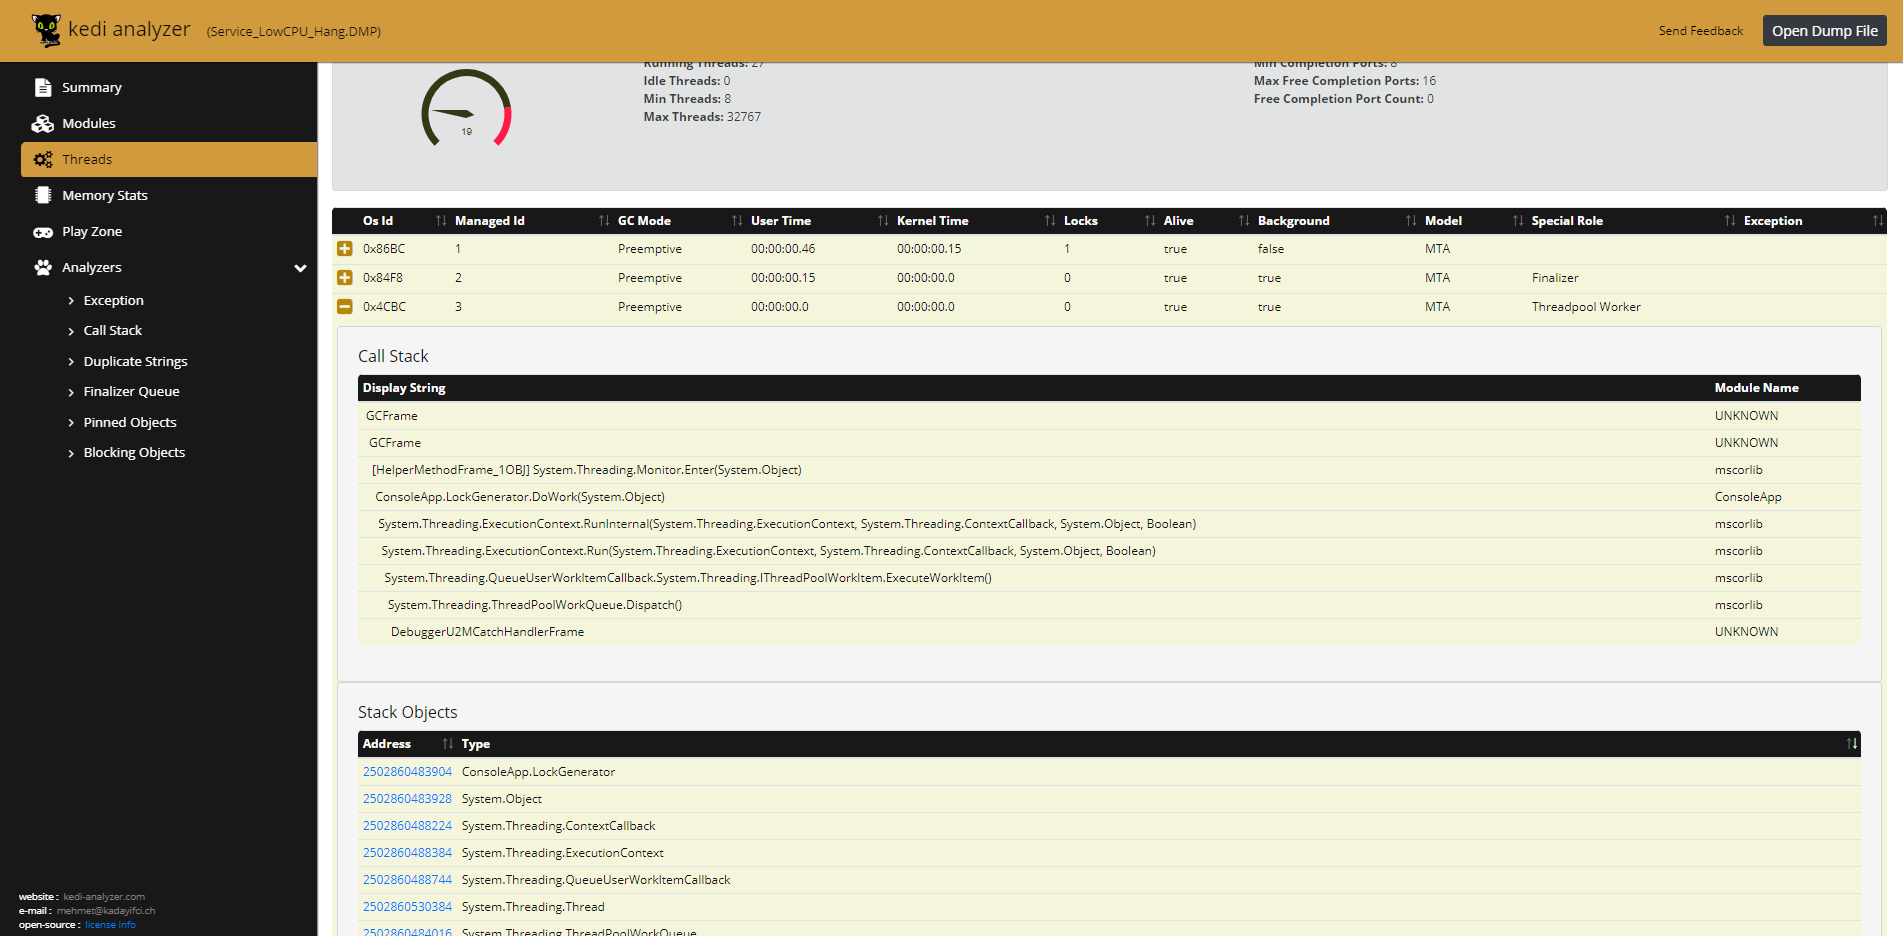
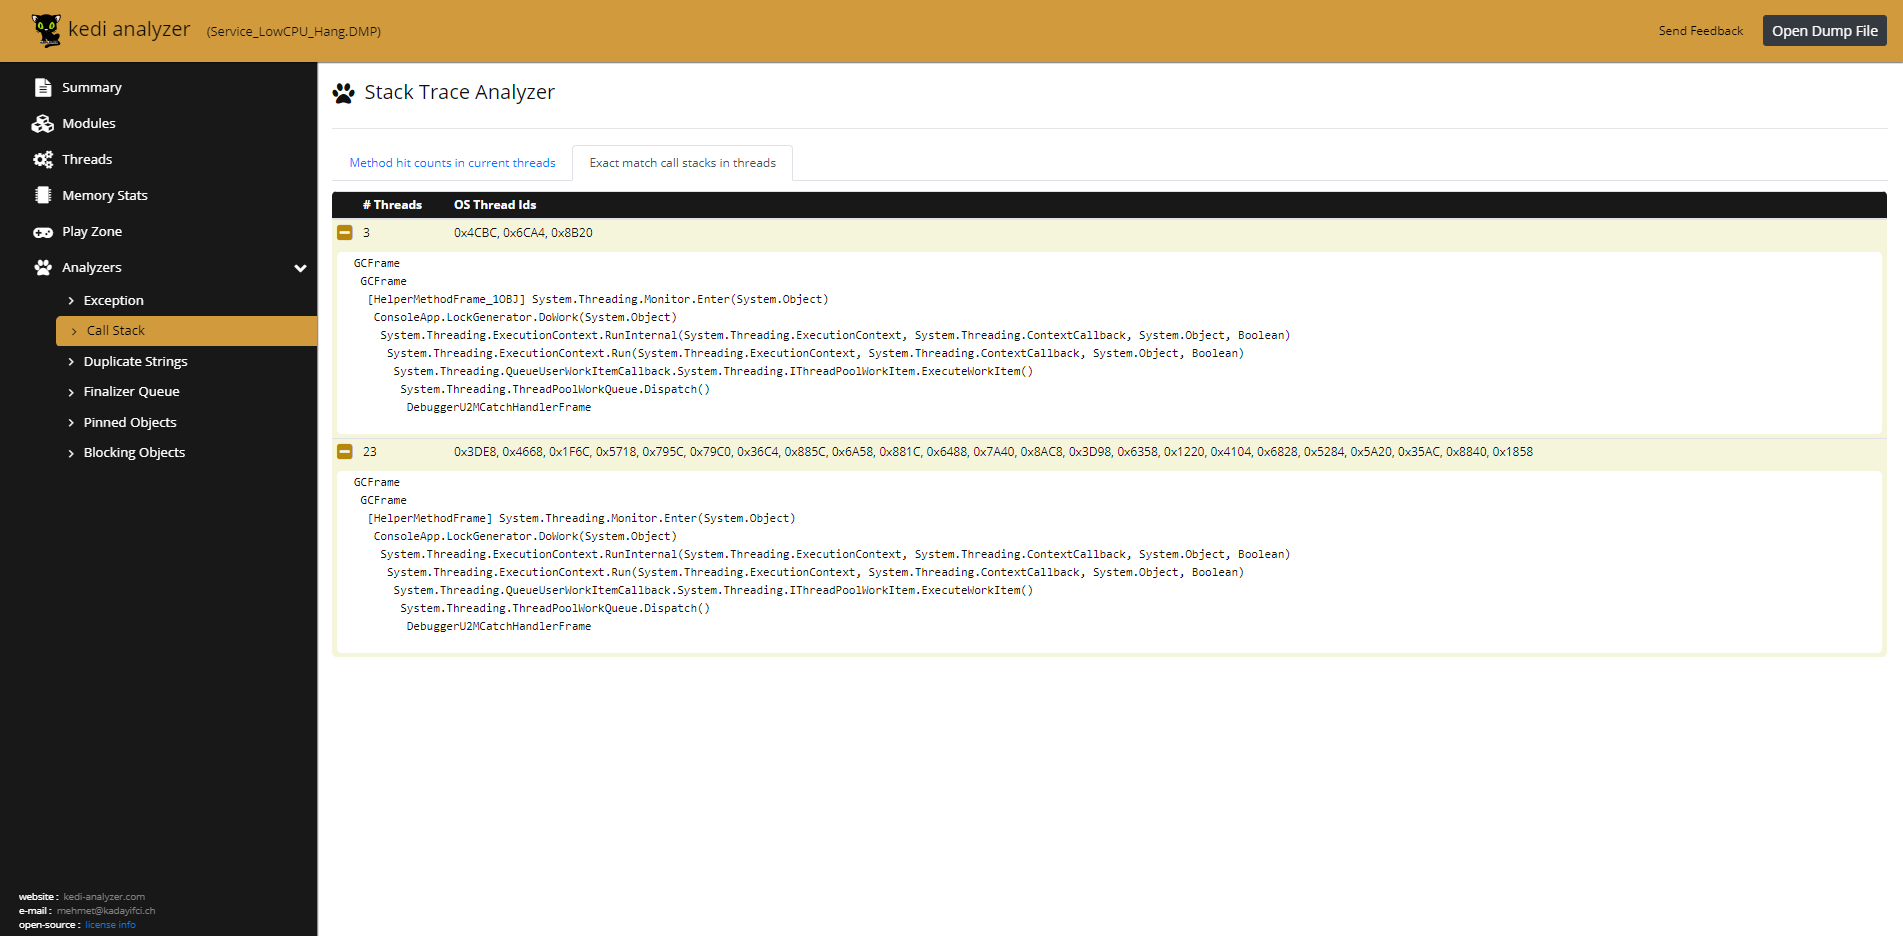
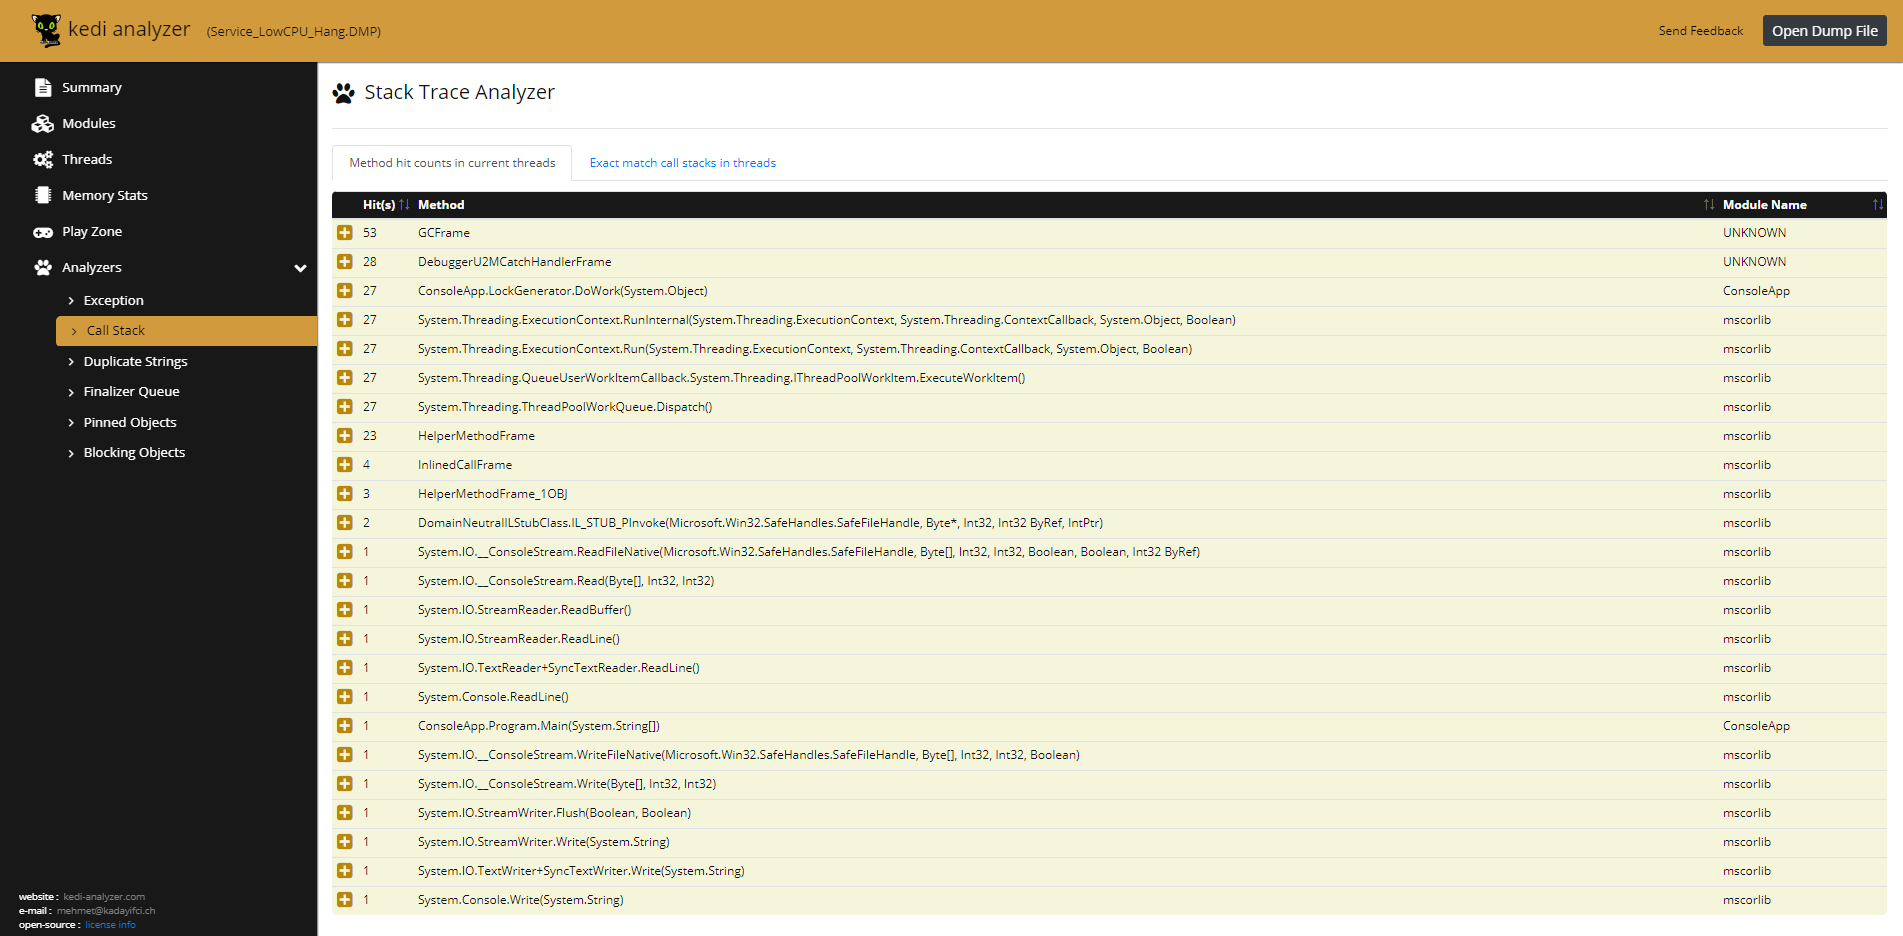
Call Stack Analysis
Kedi helps with performance analysis of call stacks. With it, you can find method hit counts in current threads. Sometimes, threads can be blocked by a synchronization block. With Kedi, you can find and resolve these issues.


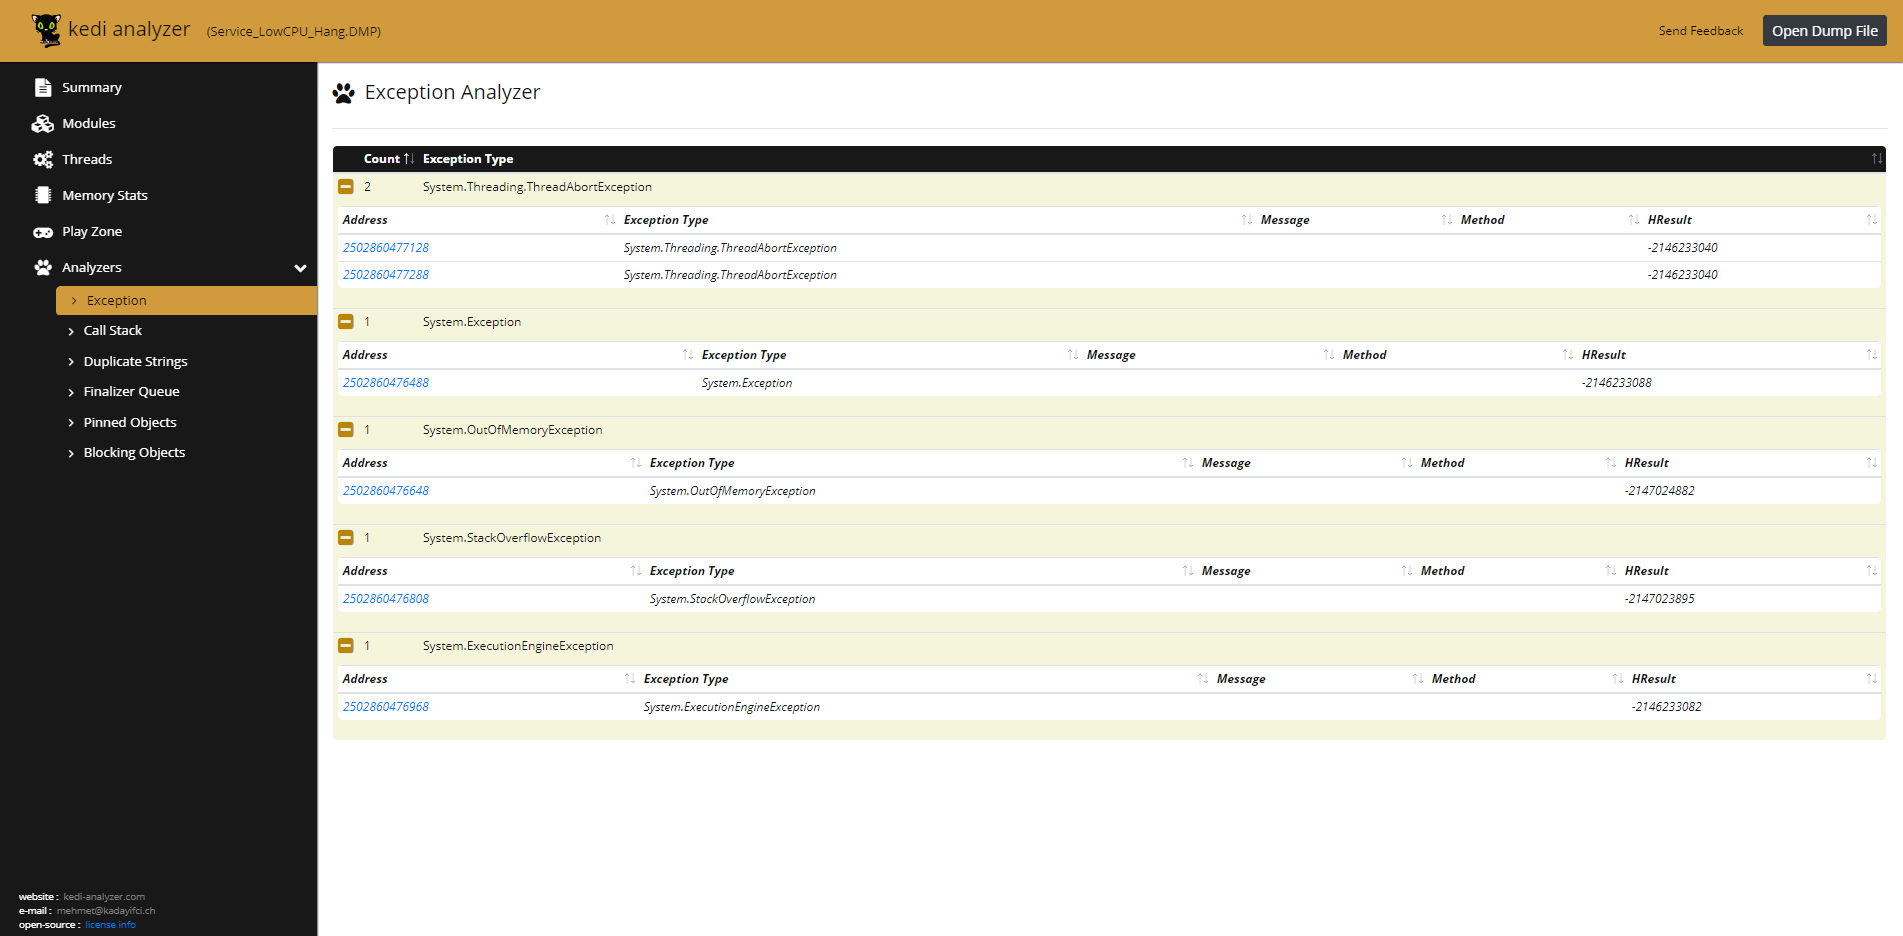
Exception Analysis
Handled or unhandled exceptions are proof of application problems. With Kedi, you can search the entire application’s memory for exceptions and useful information relating to a particular problem.

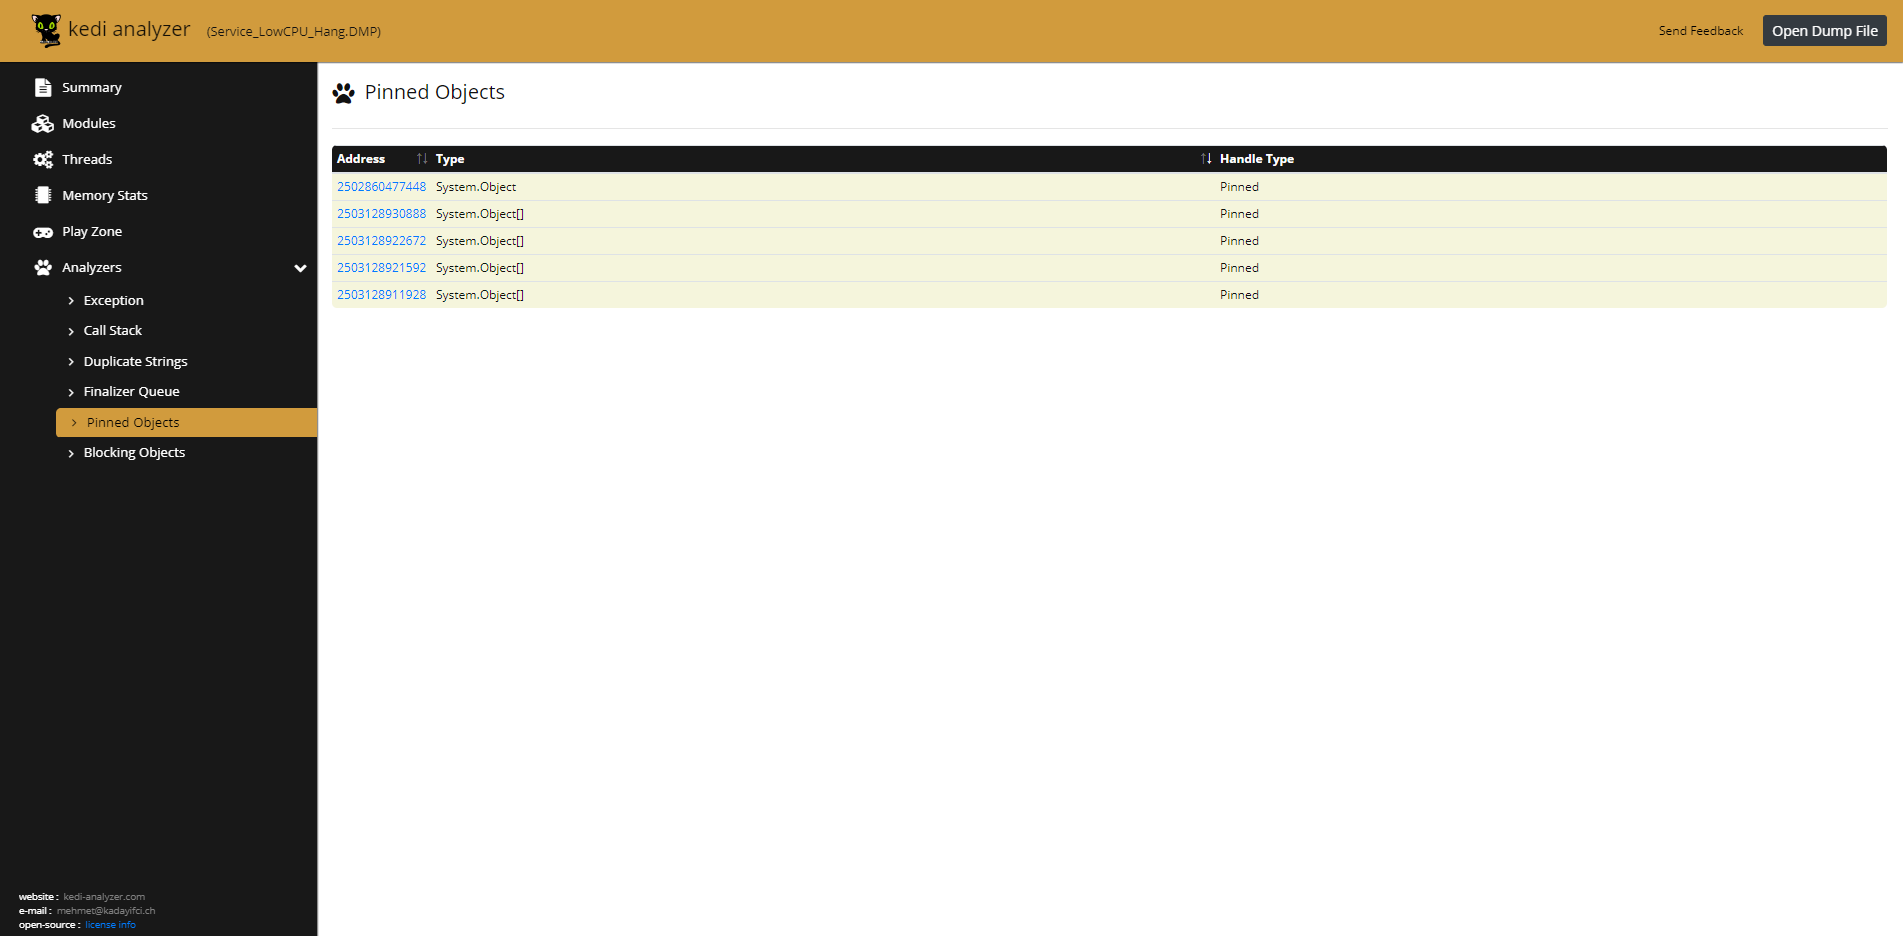
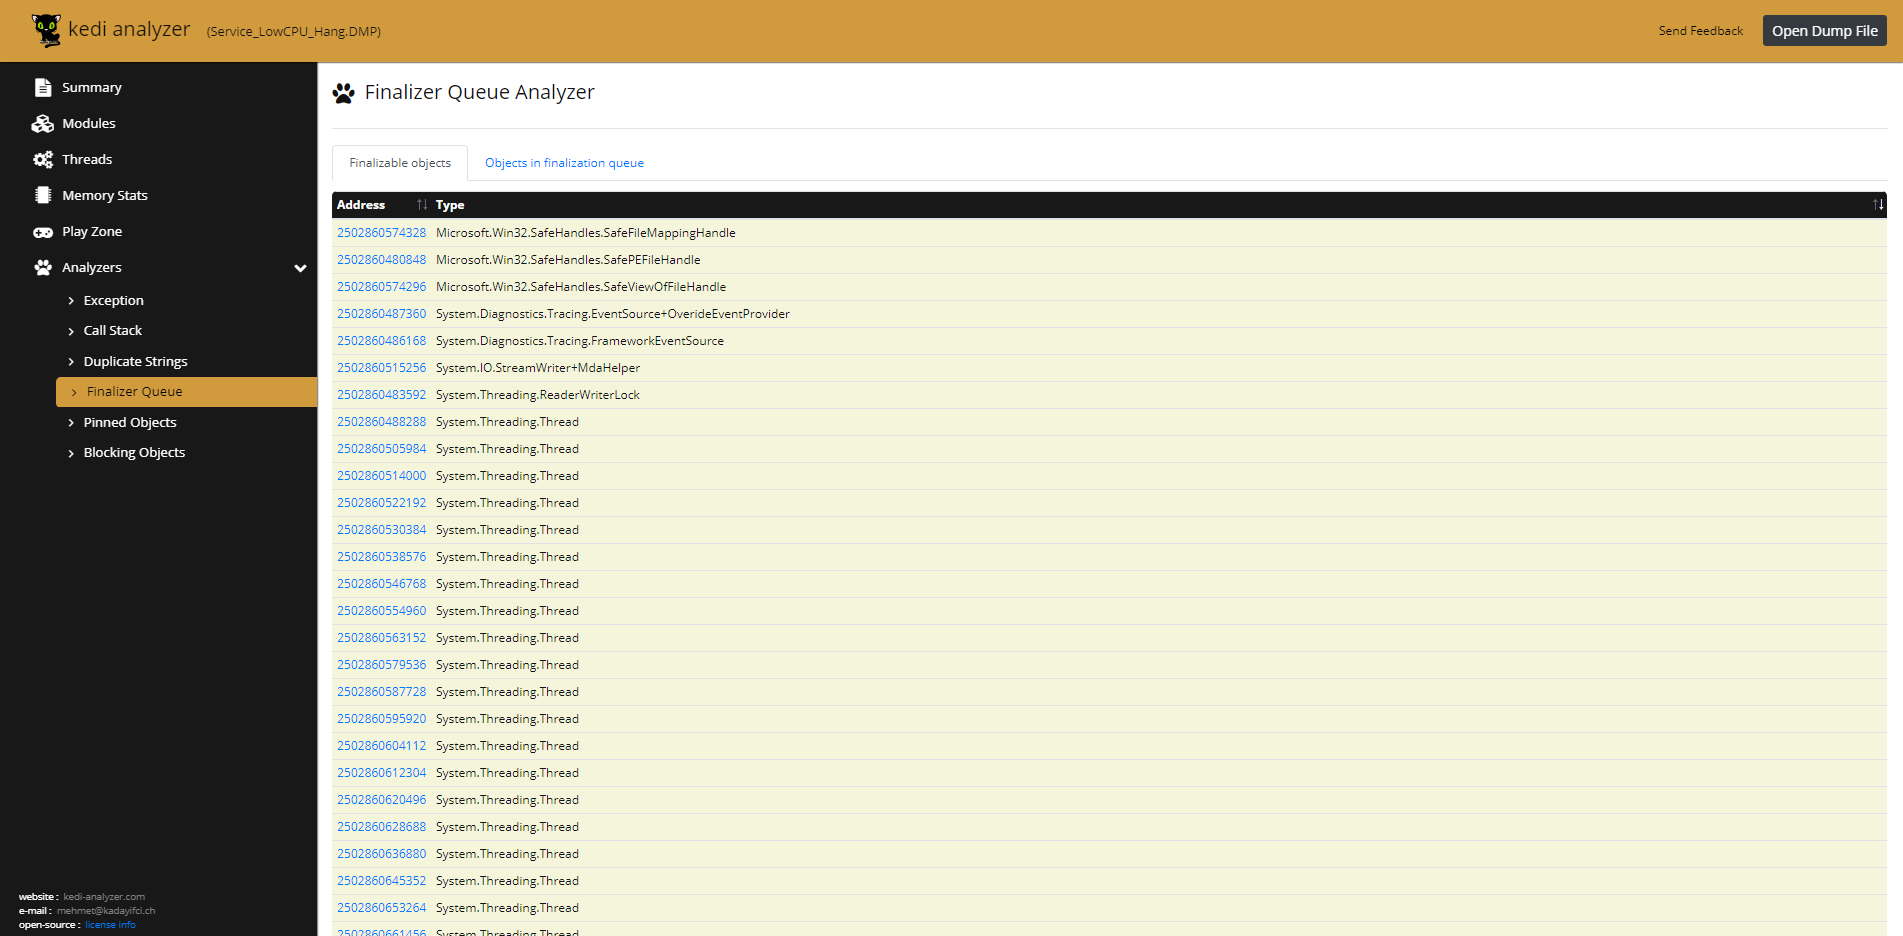
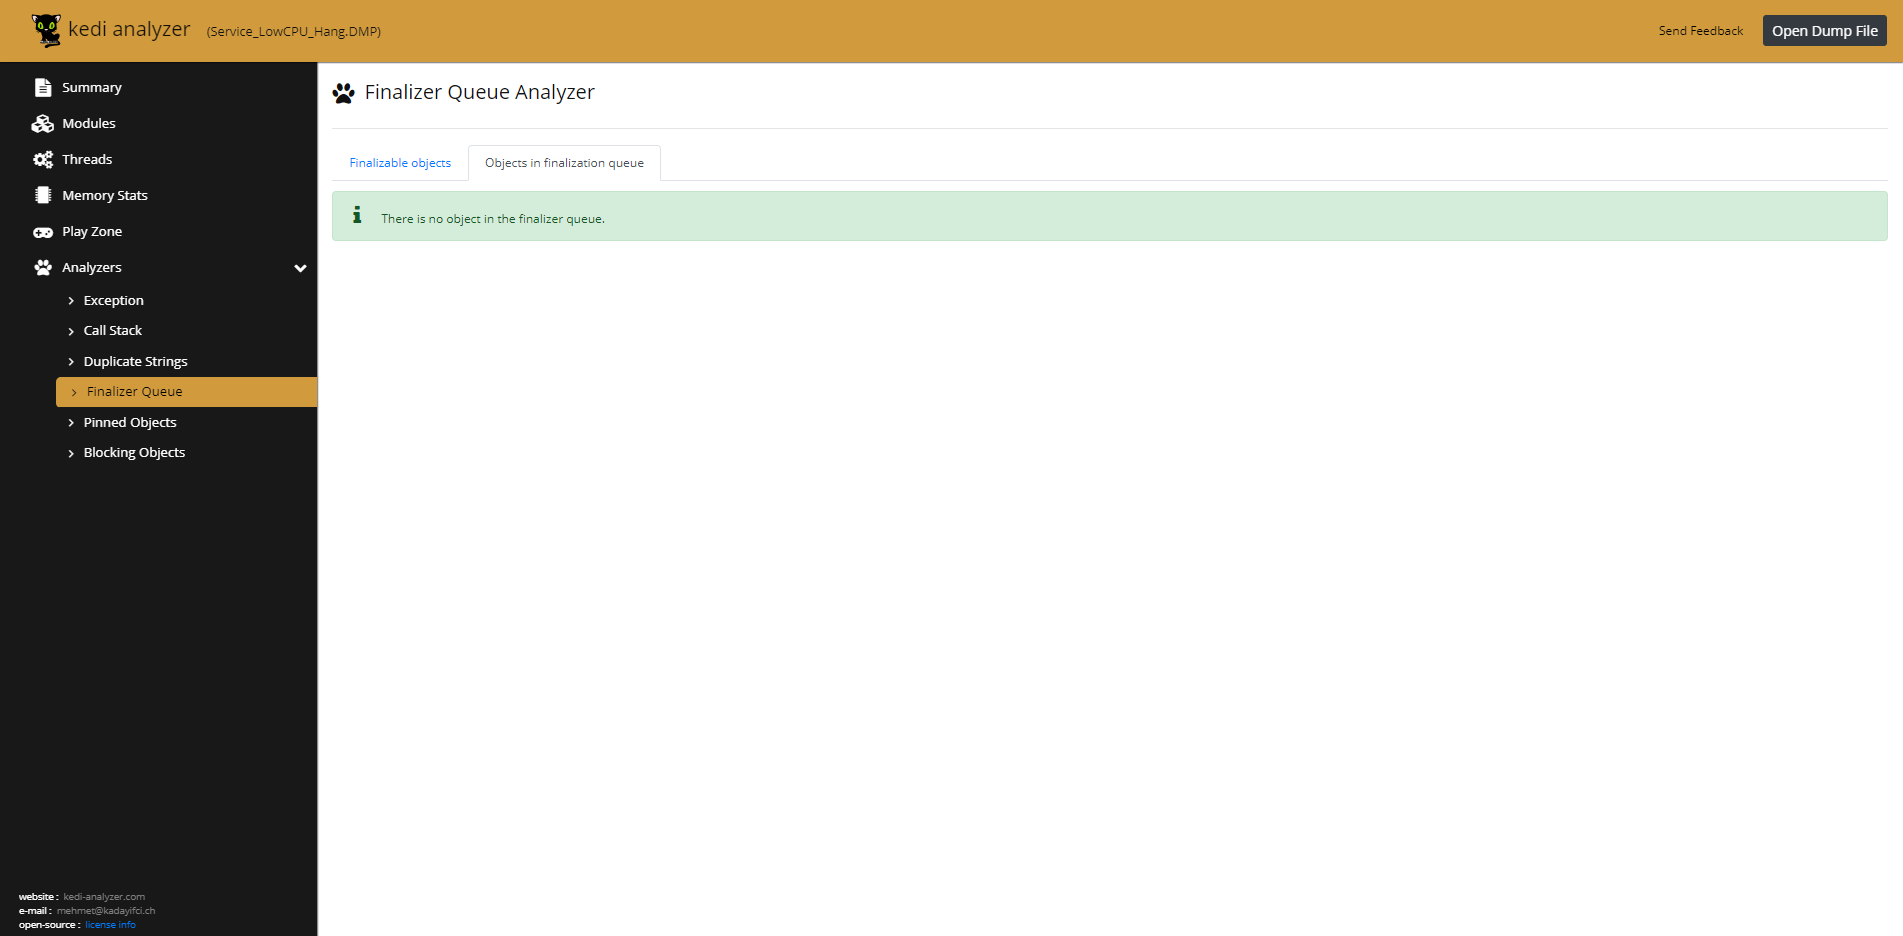
Finalizer Queue and Pinned Objects
A significant number of application problems result from Garbage Collection (GC). GC is a revolutionary method of memory management which takes memory management from the developer to the machine. It is therefore important for every developer to understand and pay attention to GC.
Disposable and Pinned objects are caveats for memory management. They are important when diagnosing and solving GC-related issues.